Start Exploring Keyword Ideas
Use Serpstat to find the best keywords for your website
Brilliant Ways to Automate SEO Routine Using Serpstat for R: SEO Dashboard


How to use Serpstat package for R?
You can find the primary documentation here. The easiest way to run R code is to use Google Colab. So we will use it here as a development environment.
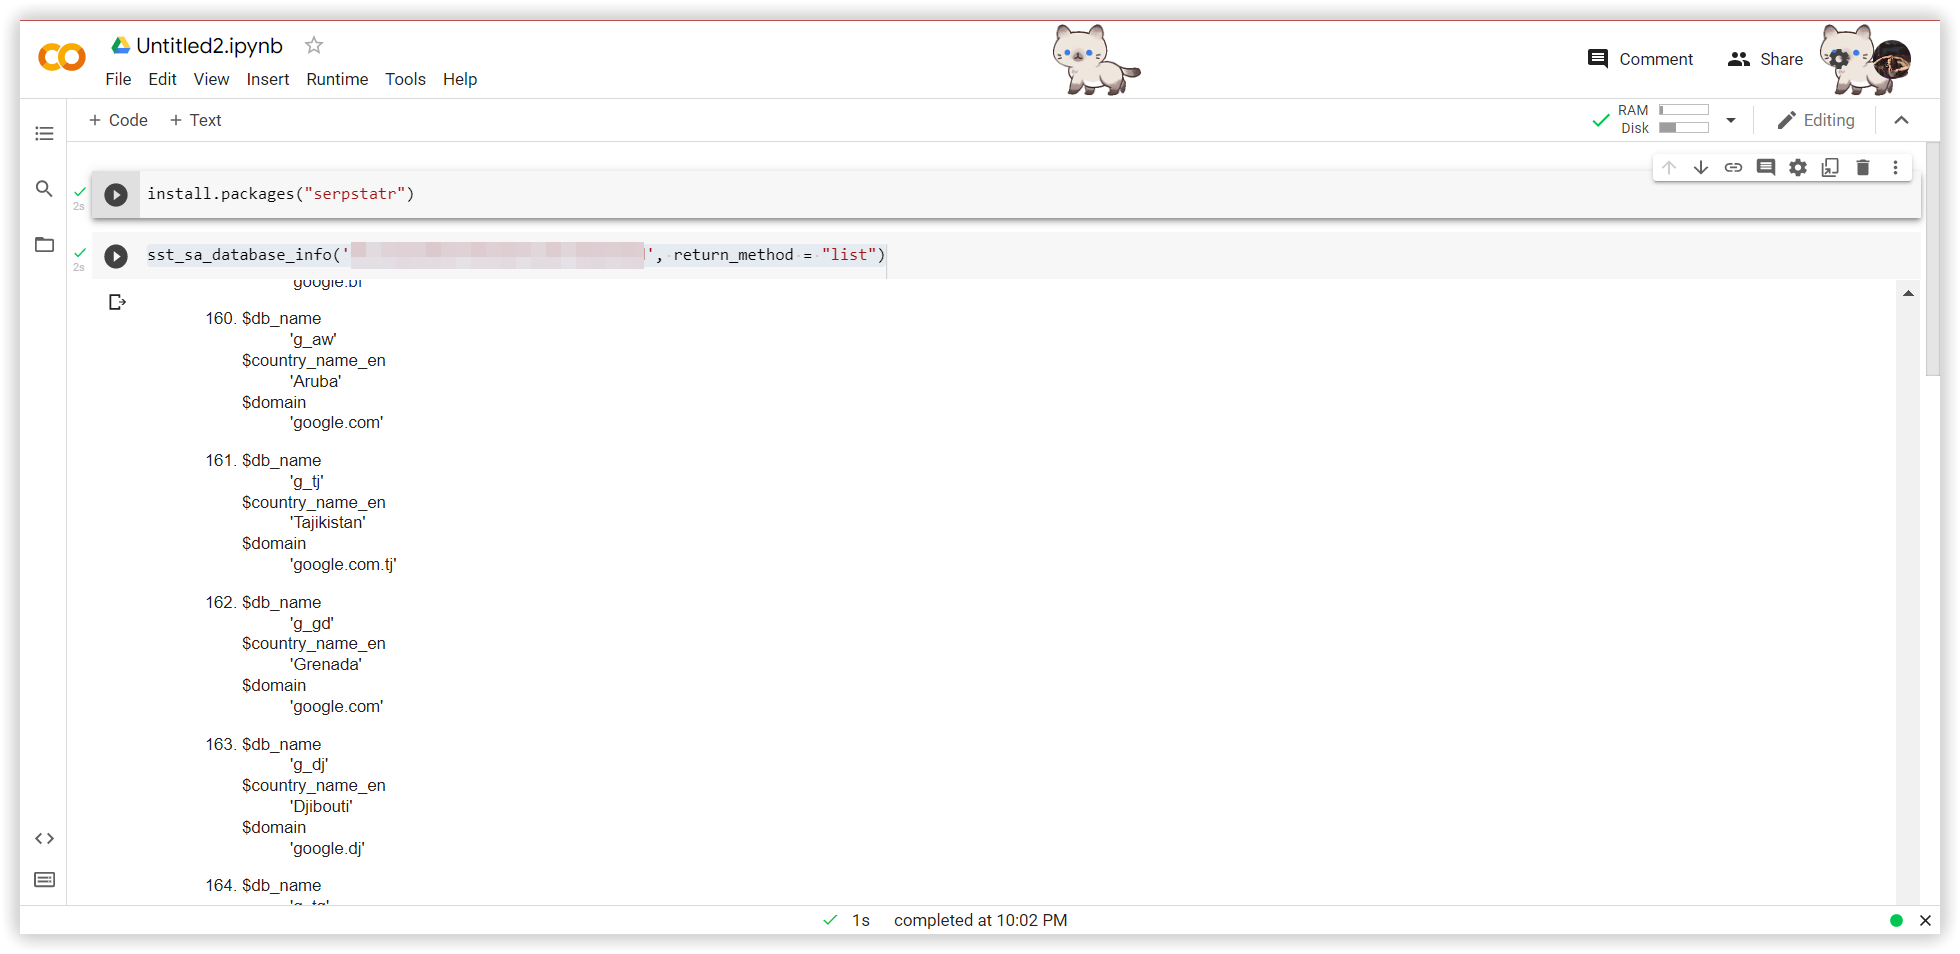
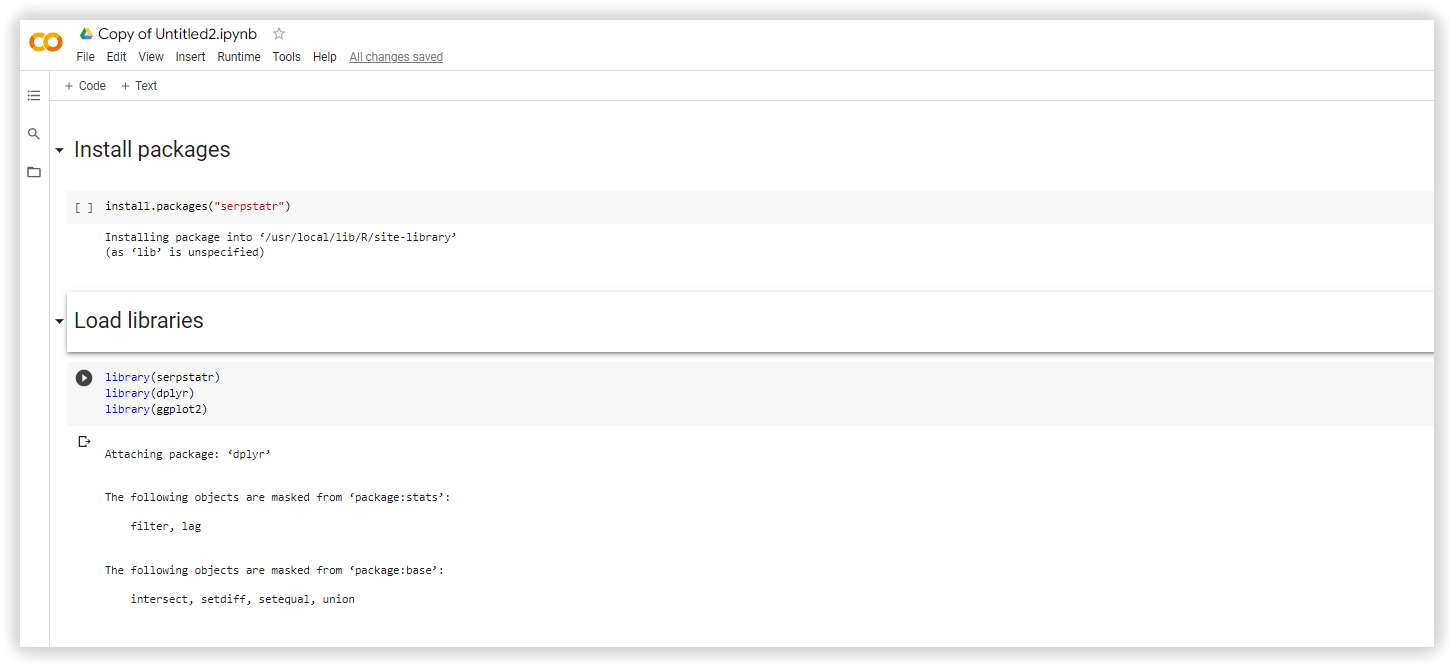
install.packages("serpstatr")
library(serpstatr)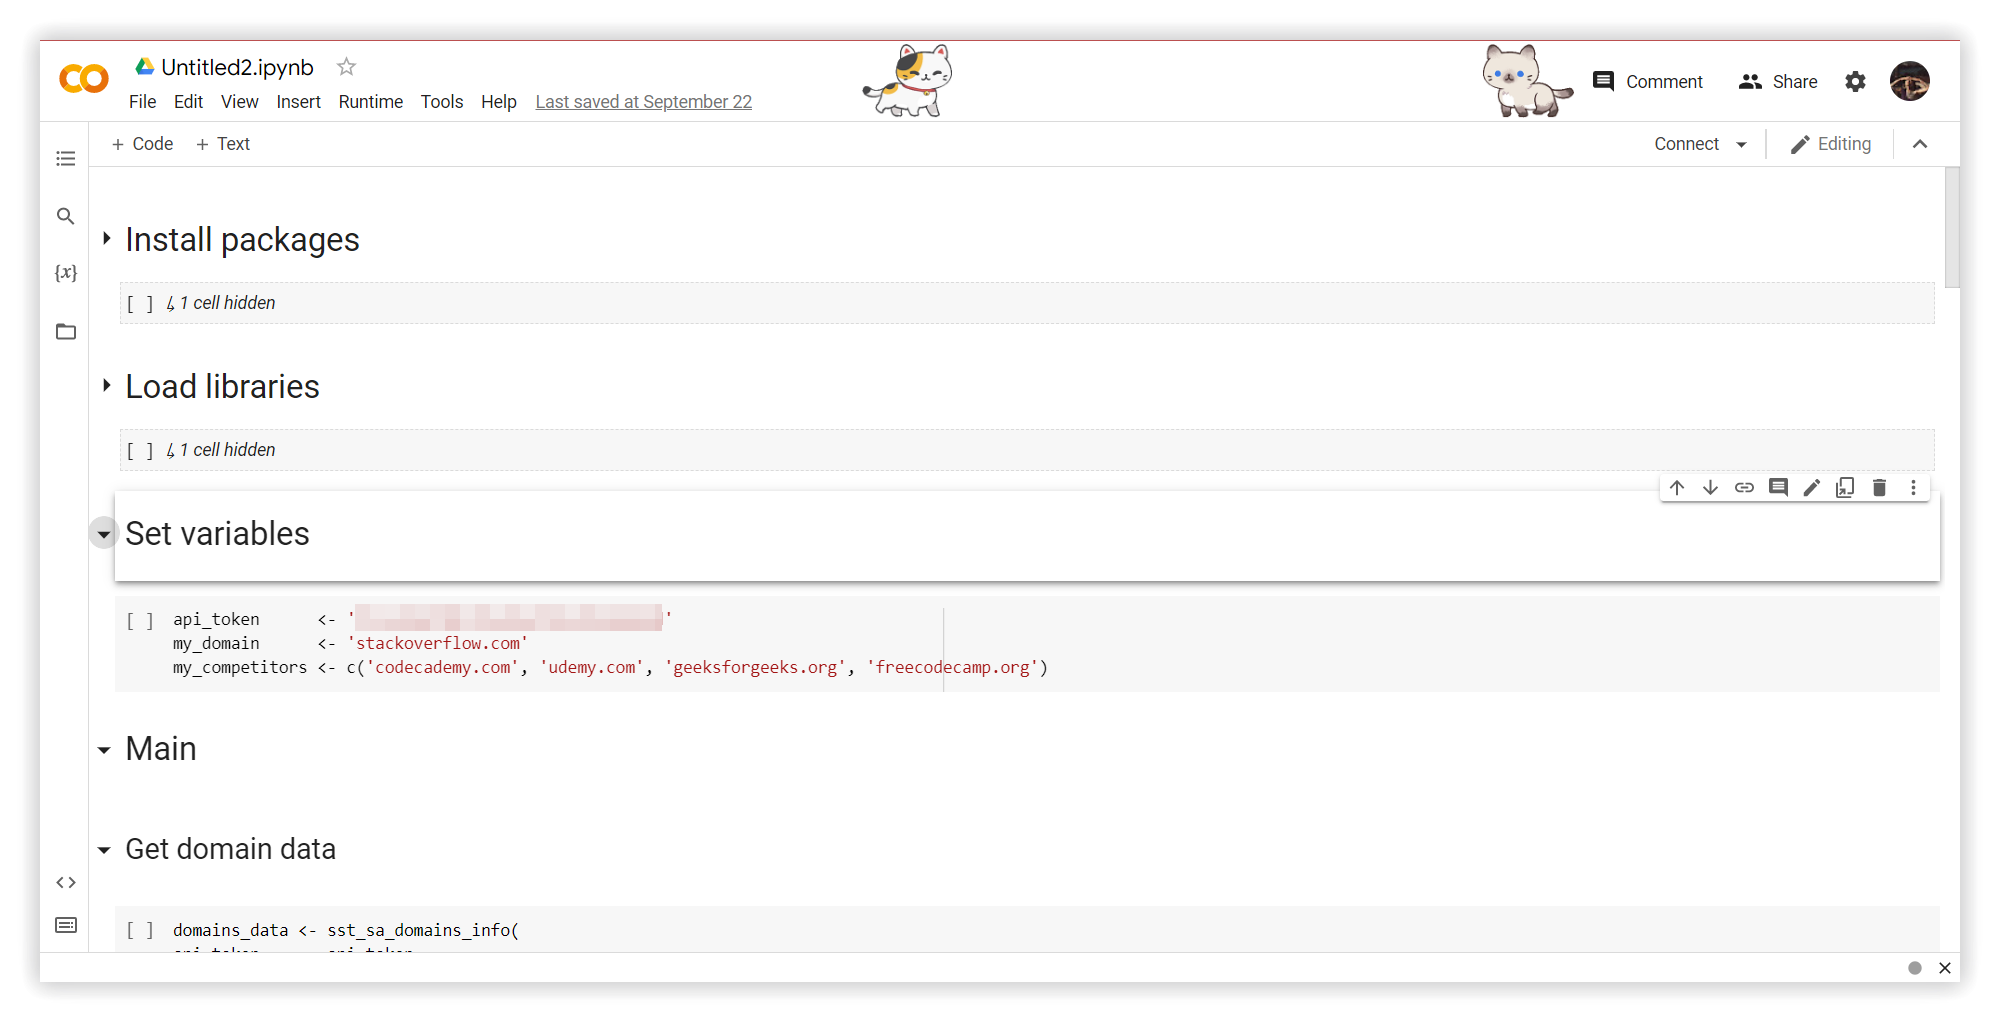
R wrapper for your dashboard
A dashboard is a great way to look at overall website performance. Instead of spending hours analyzing data in multiple reports, you can easily track the keywords and positions of your website. If you're a business owner, you can track all SEO changes and paid campaigns' effectiveness.
An informative panel is also a quick way for SEOs to keep track of the overall progress throughout the year, creating one for each project. This way, you can keep track of the numbers for each search database (like google.com and google.co.uk). Additionally, you can visualize data for further analysis.
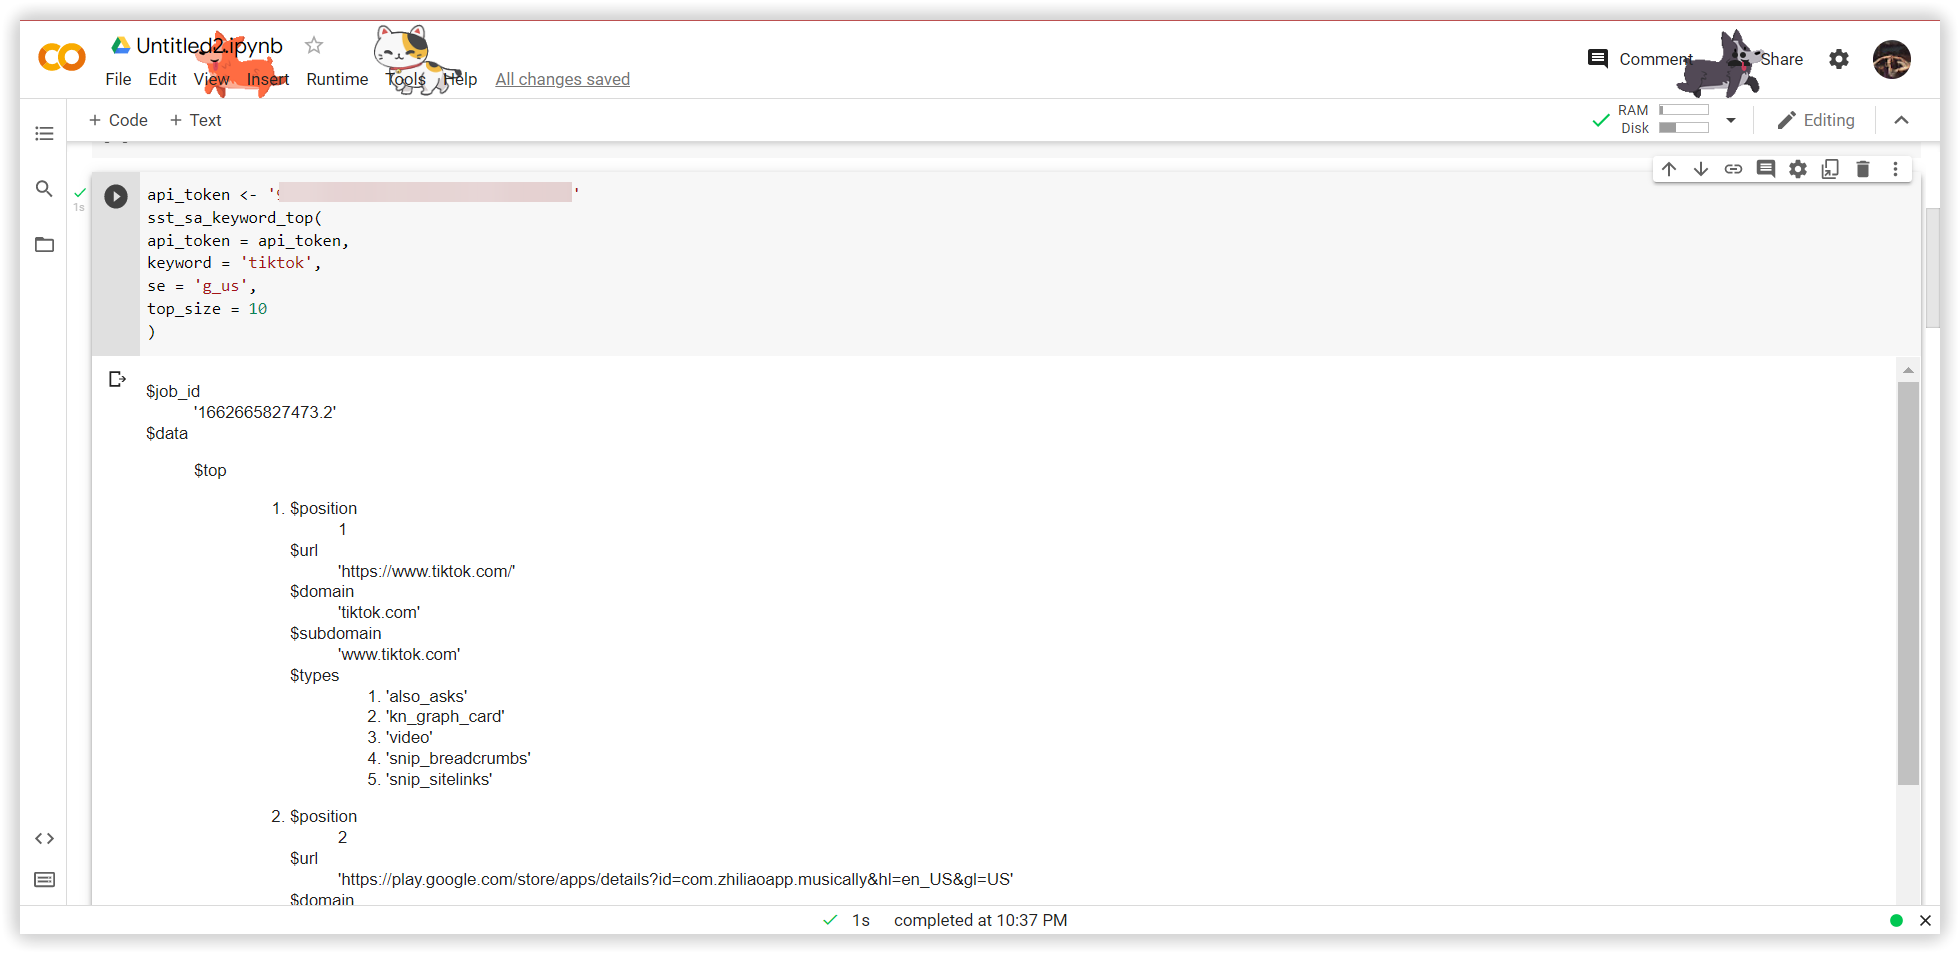
An example:
sst_sa_keyword_top(
api_token = api_token,
keyword = 'tiktok',
se = 'g_us',
top_size = 10
)
An example:
api_token <- Sys.getenv('SERPSTAT_API_TOKEN')
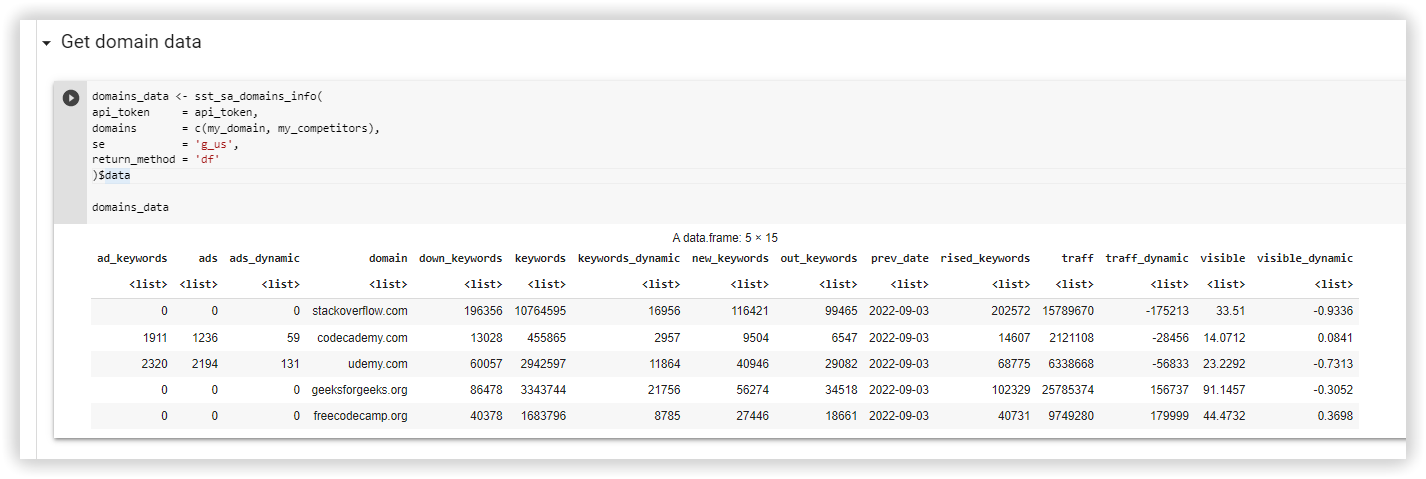
sst_sa_domains_info(
api_token = api_token,
domains = c('amazon.com', 'ebay.com'),
se = 'g_us',
return_method = 'df'
)$data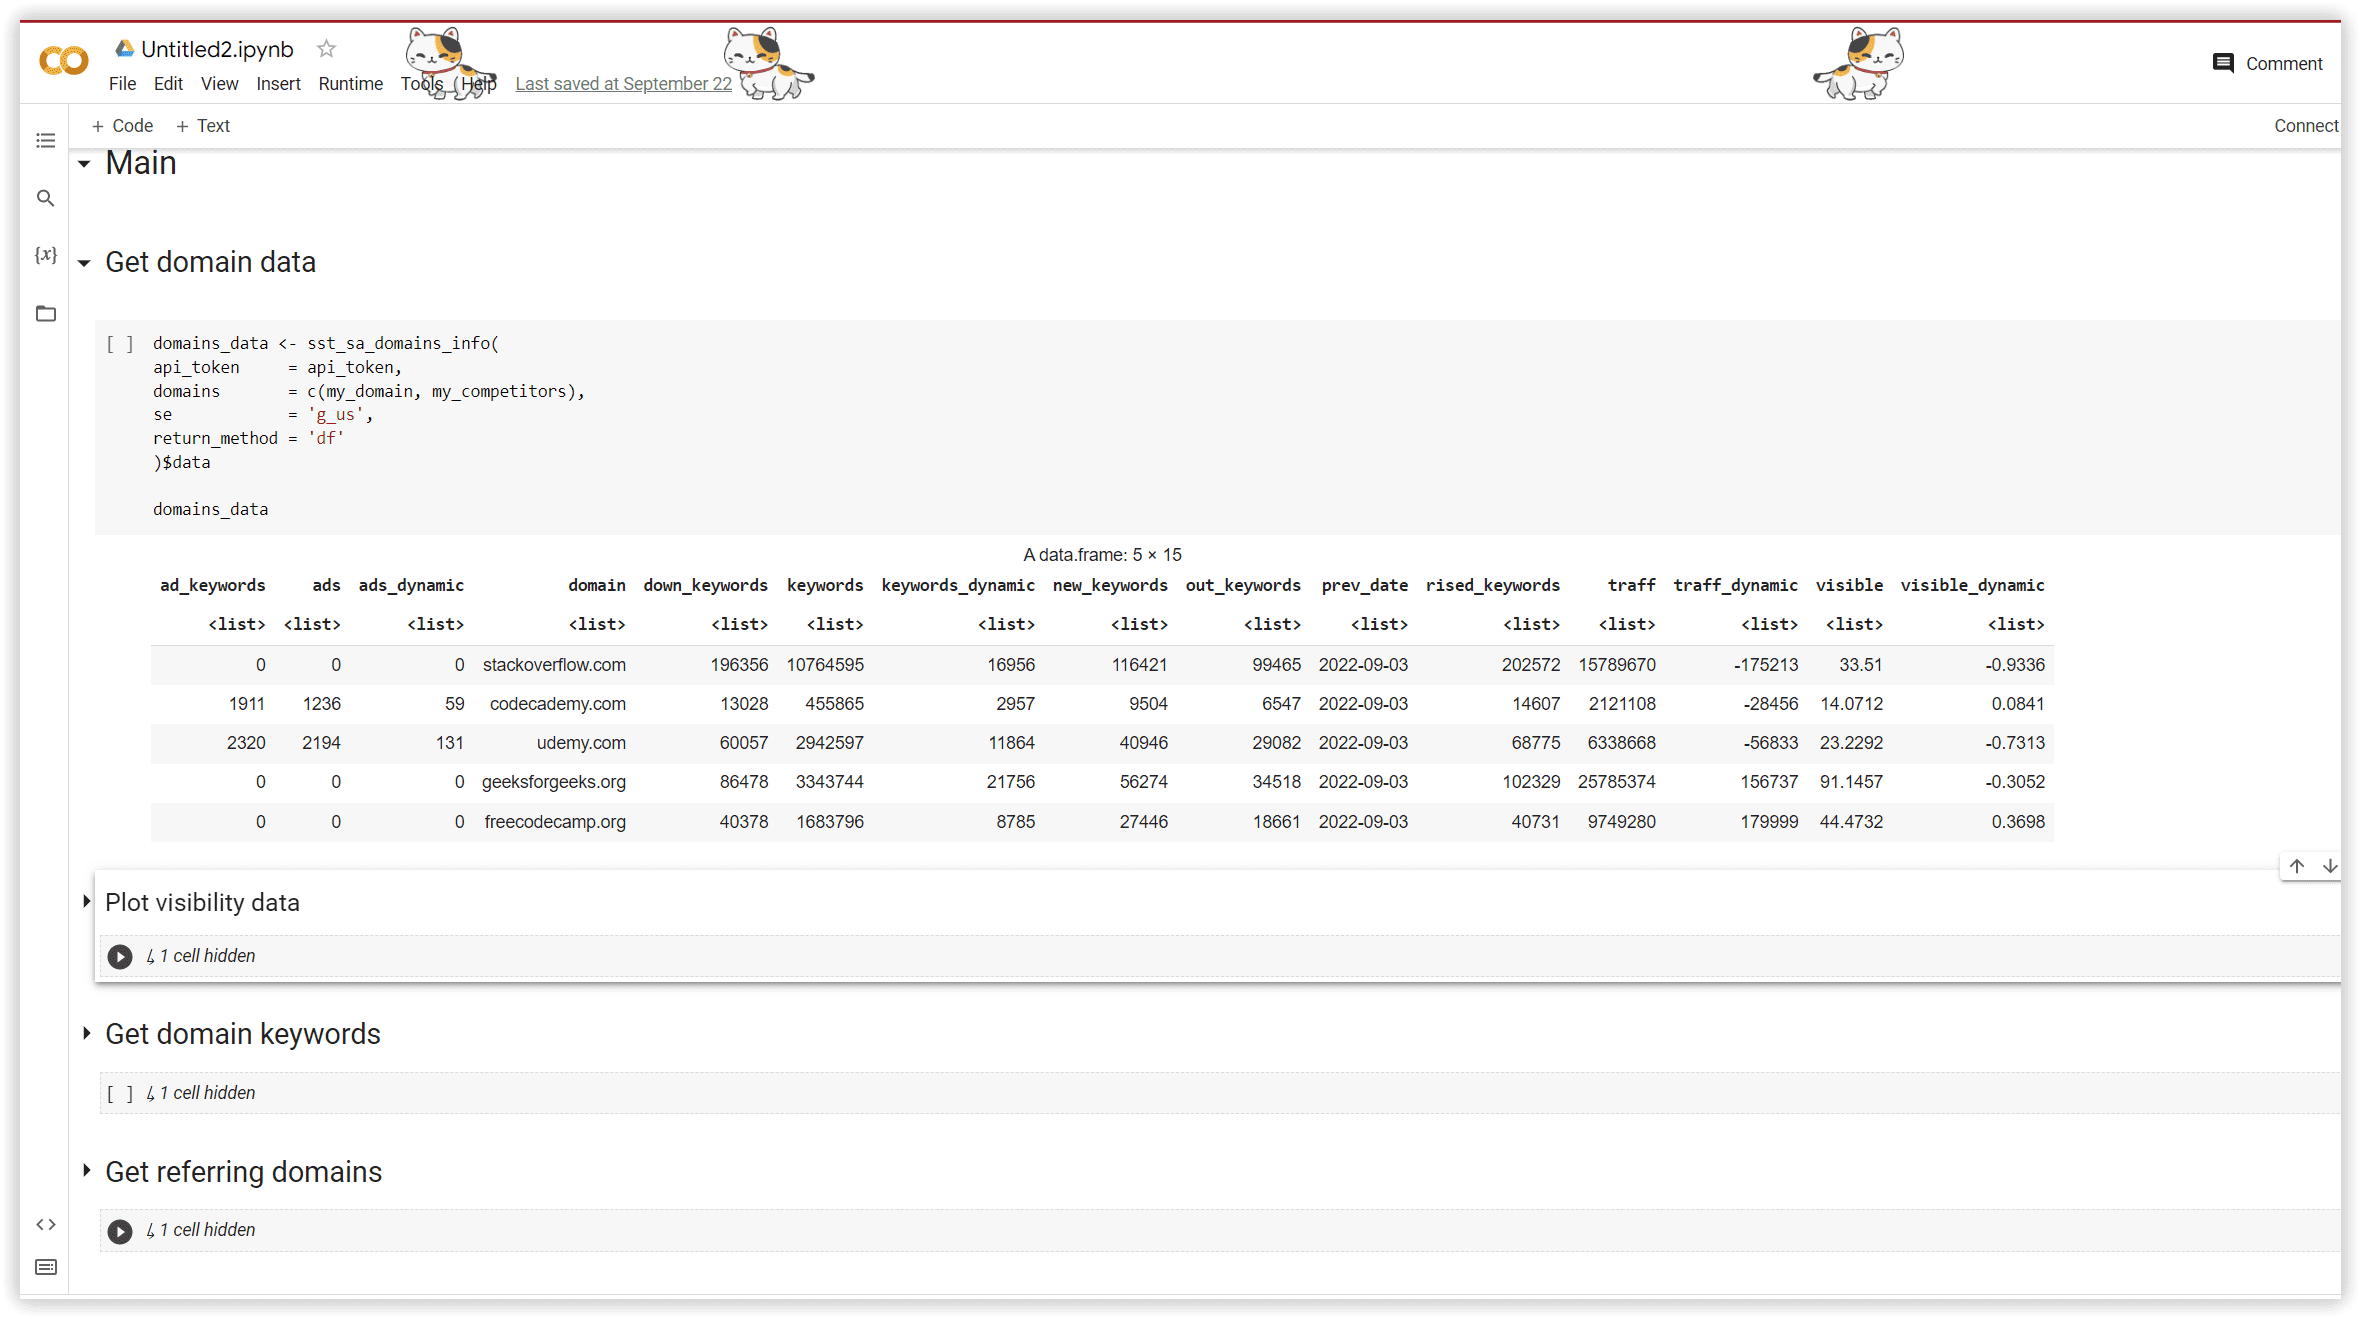
Another element you can add to your new dashboard is sst_sa_domain_keywords or Domain organic keywords. This method returns up to 60 000 organic keywords from a selected region for the domain, with metrics for each keyword. To include or exclude some keywords, you can use the filtering parameters.
For example:
url = 'https://www.seroundtable.com/',
keywords = list('google'),
minusKeywords = list('update'),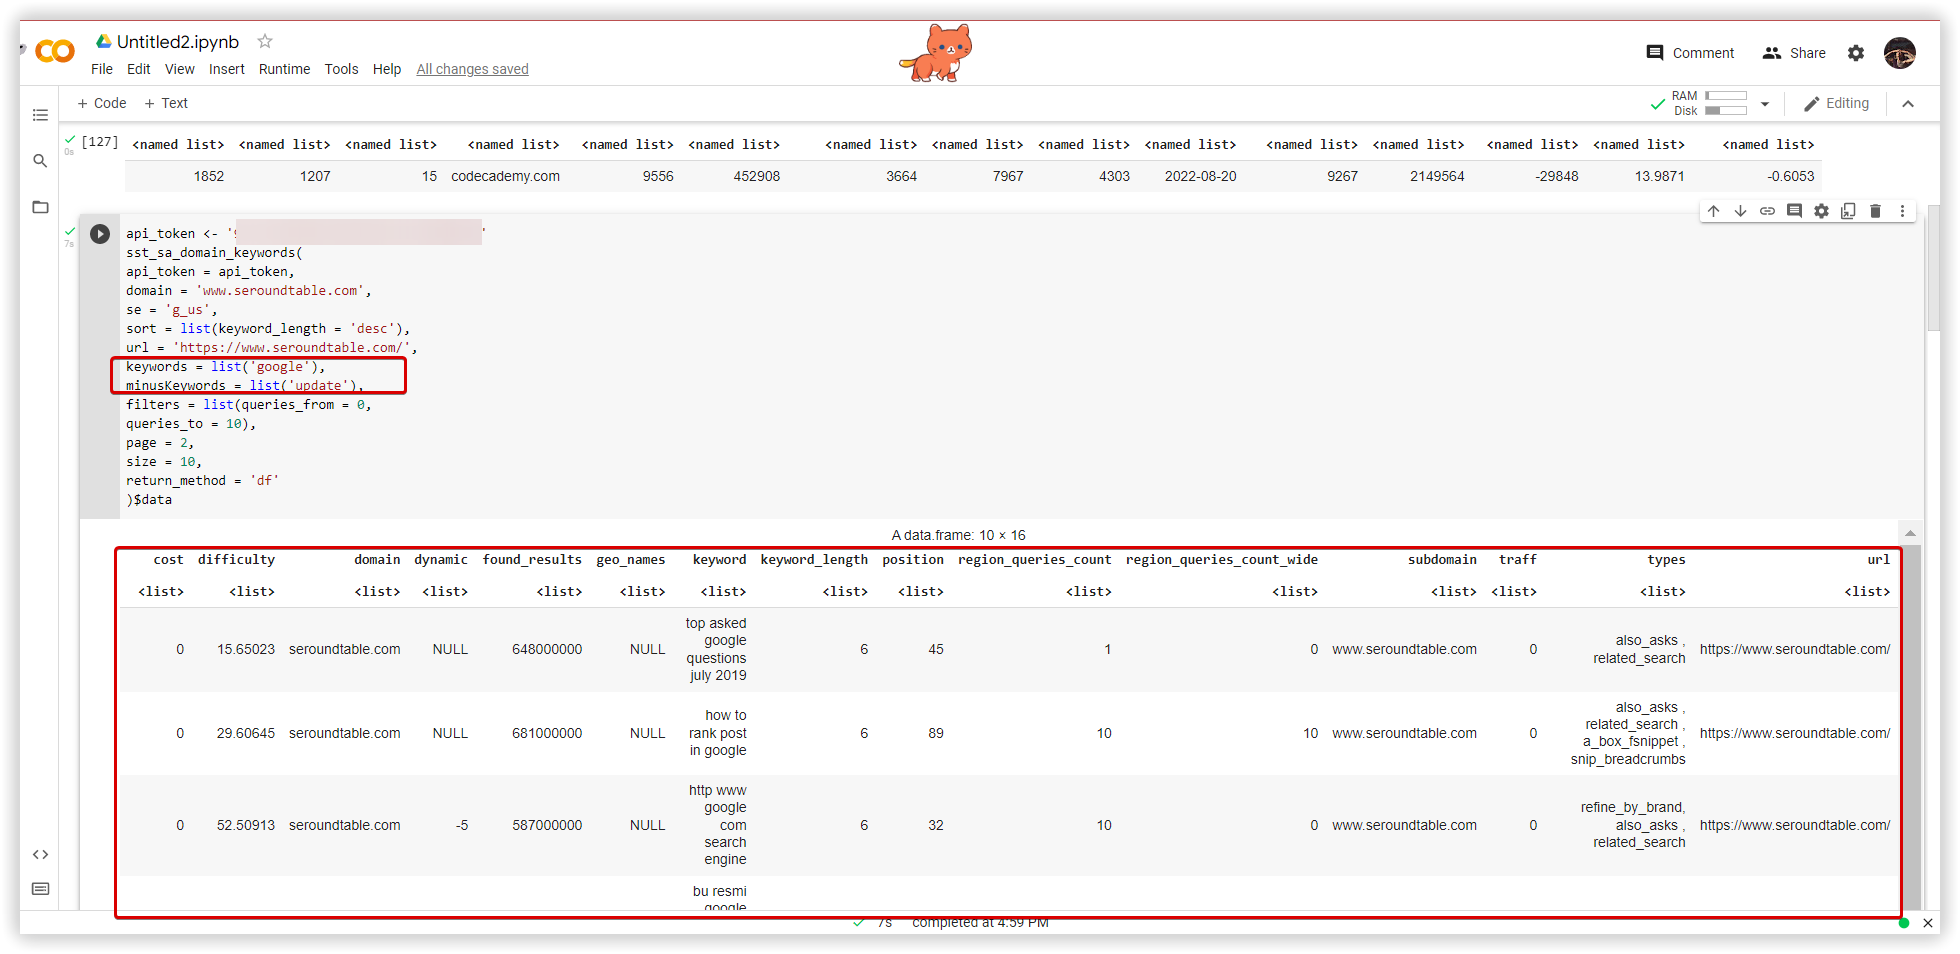
sst_bl_referring_domains(
api_token = api_token,
domain = 'seroundtable.com',
page = 1,
size = 100,
sort = 'domain_rank',
order = 'desc',
filter = NULL,
return_method = 'list'
)$data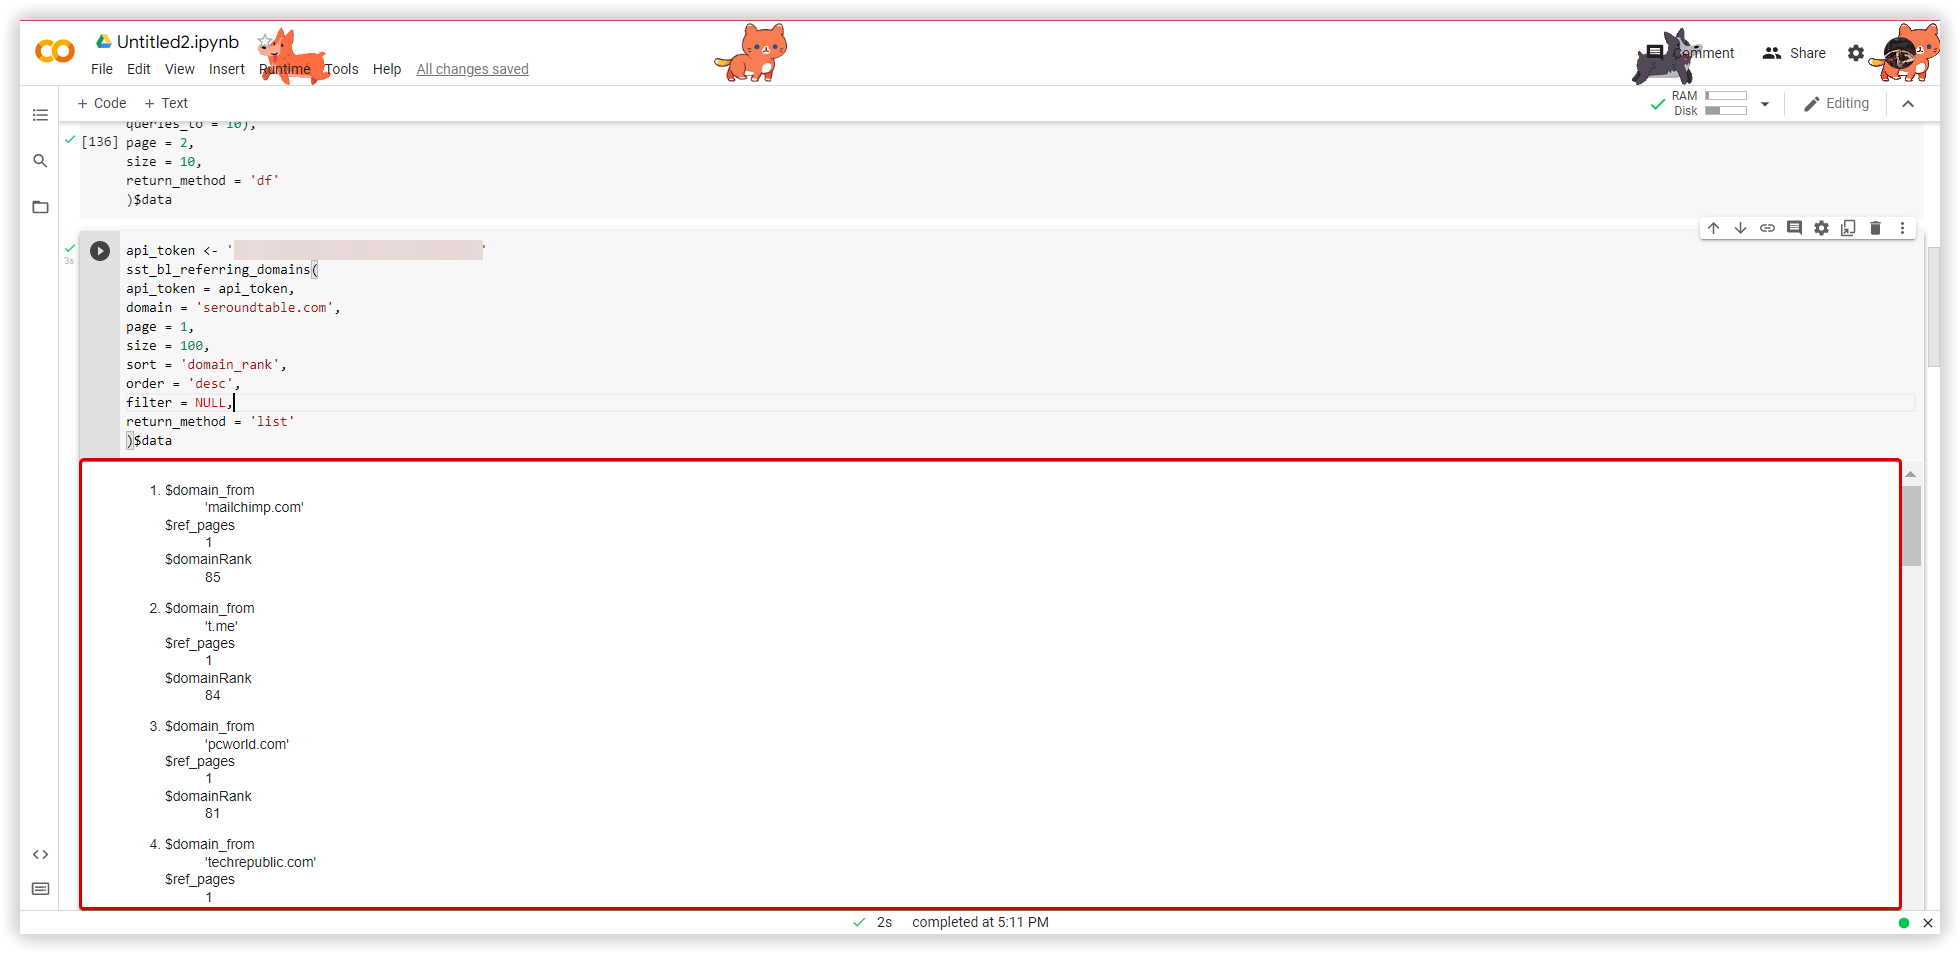
Now, we came to the sst_rt_competitors Rank tracker method. It wraps around the getTopCompetitorsDomainsHistory API method and returns the competing domains in the top 20 of SERP for your project in the Rank Tracker. Arguments required for this method are:
- api_token;
- project_id — the identificator of your project in Serpstat from the URL of any rank tracker report;
- region_id — the identificatior of a region;
- date_from — date string in ’YYYY-MM-DD’ format;
- date_to — date string in ’YYYY-MM-DD’ format.
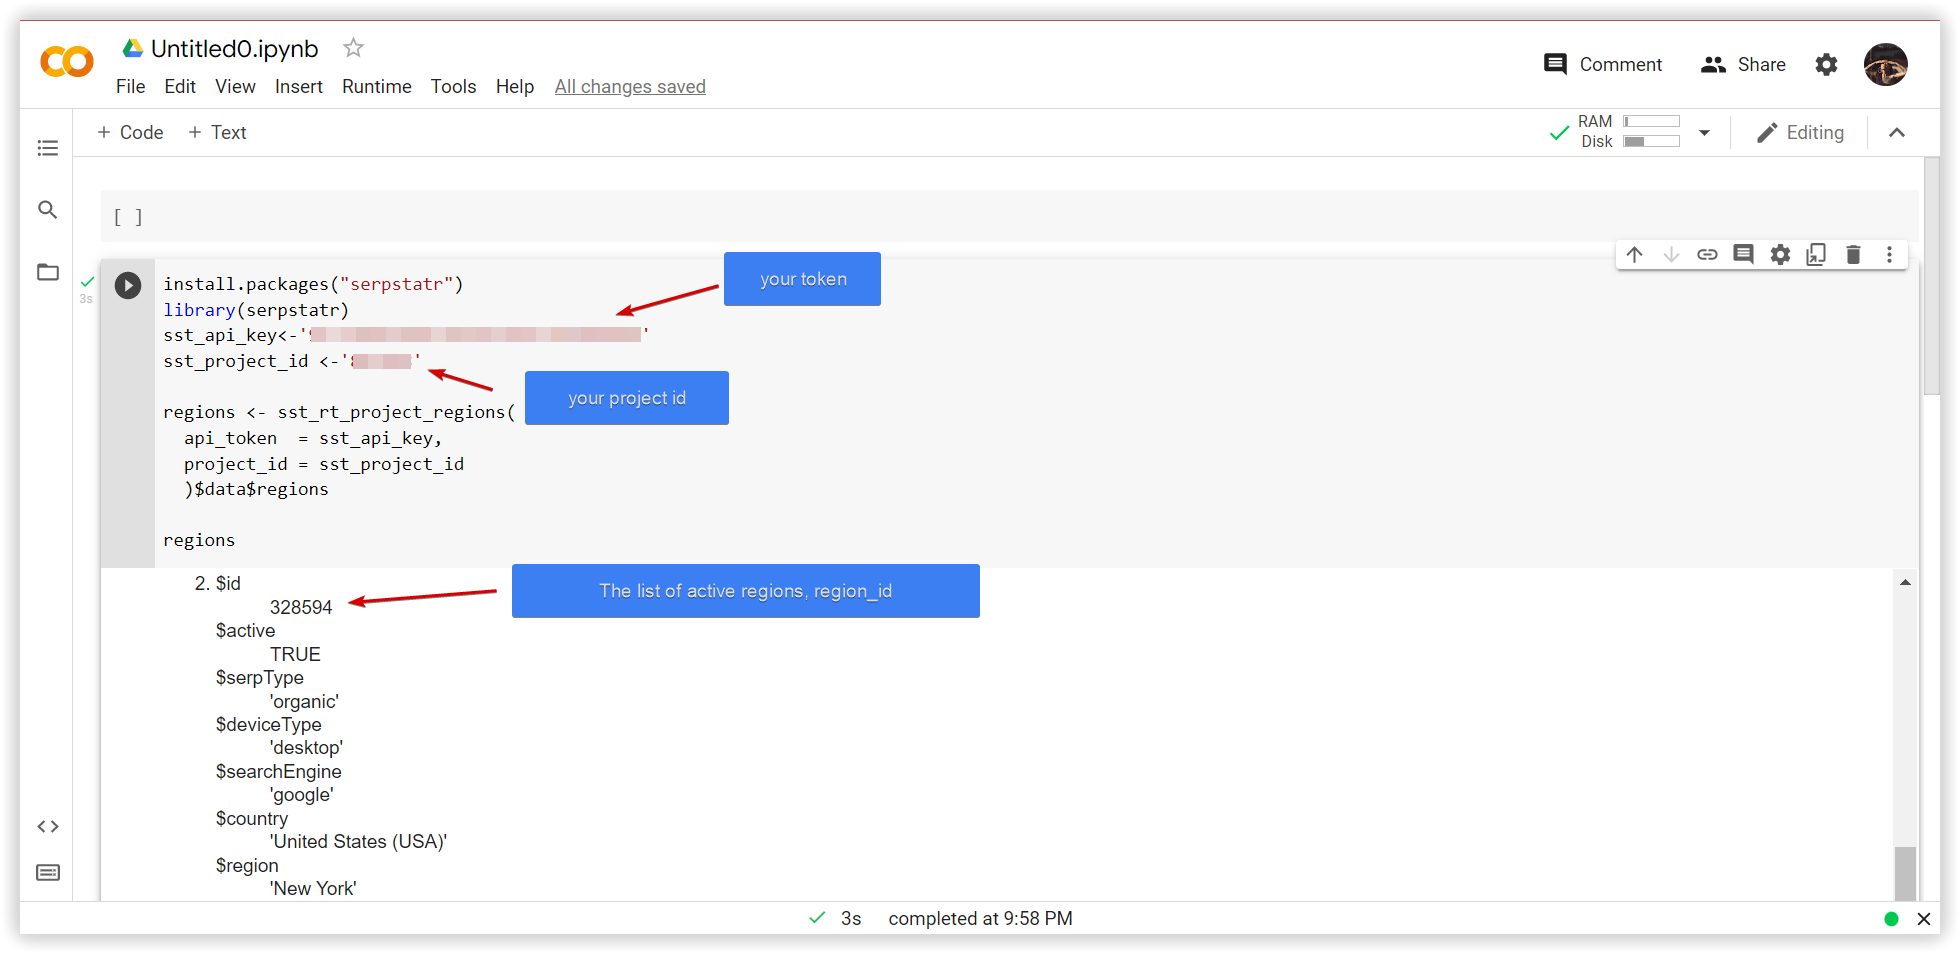
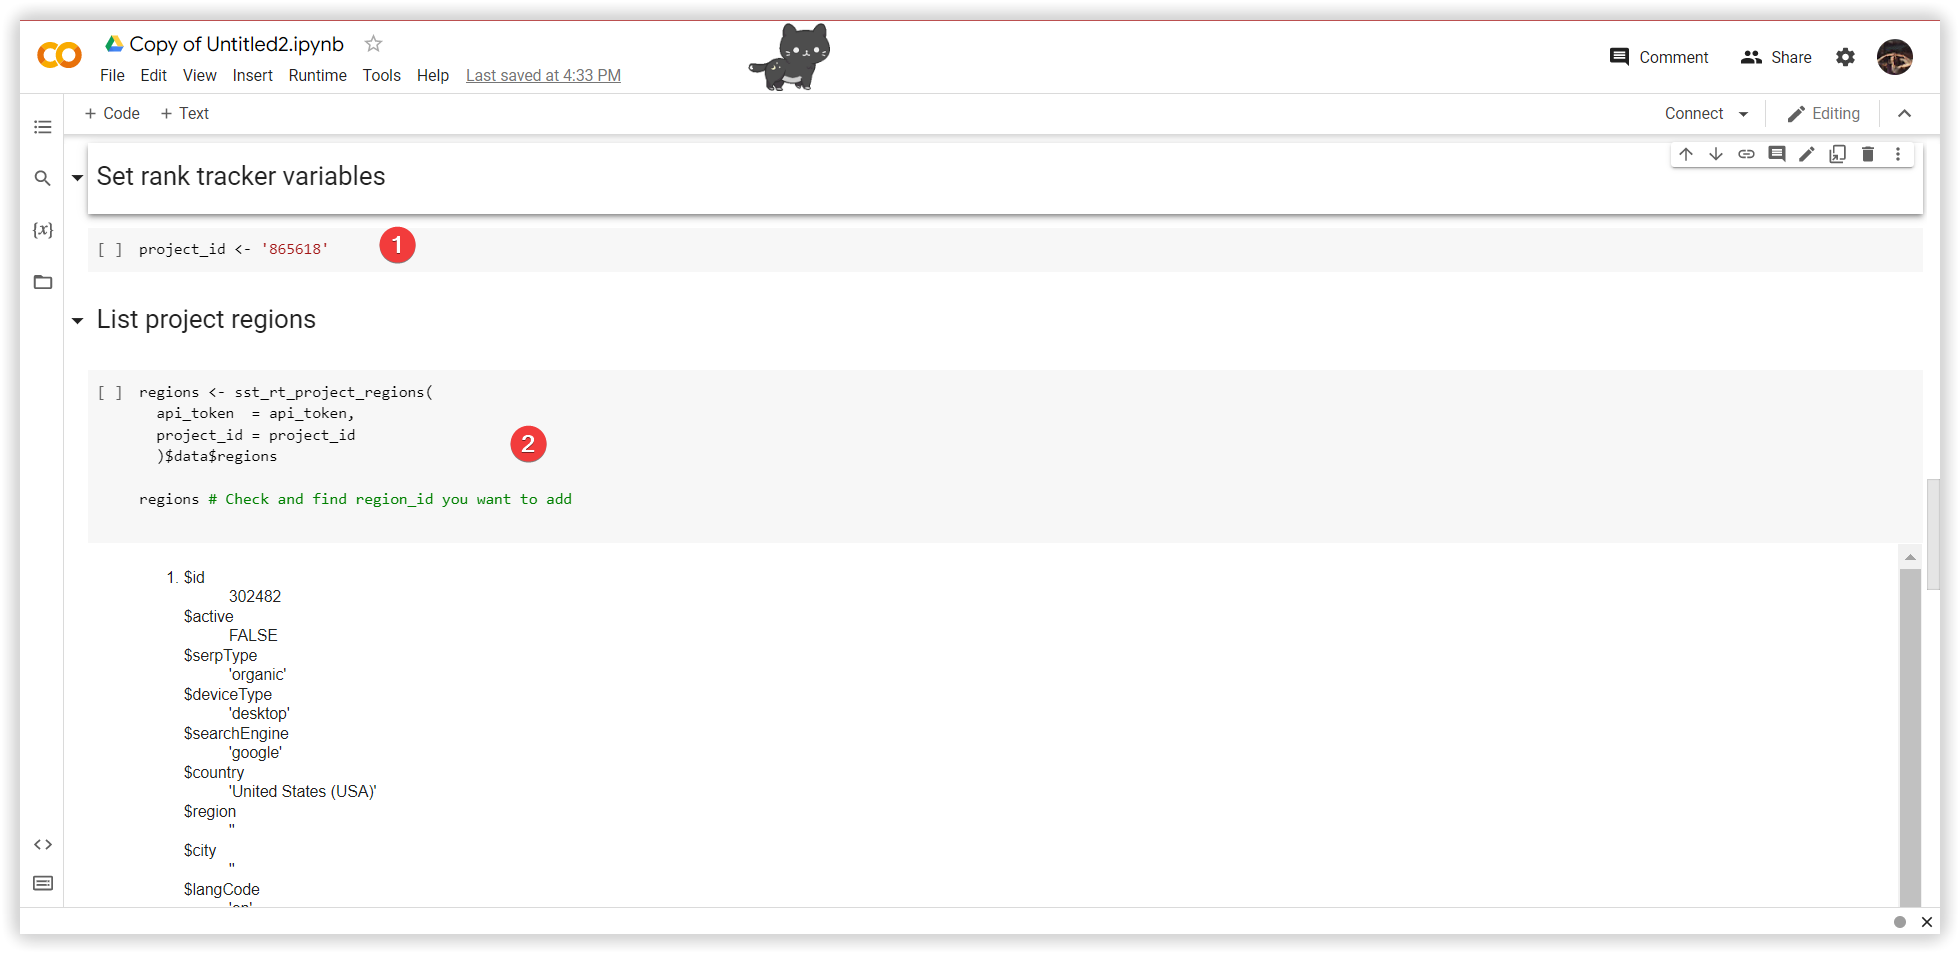
regions <- sst_rt_project_regions(
  api_token  = api_token,
  project_id = project_id
  )$data$regions

regions # Check and find the region_id you want to use
region_id <- regions[[2]]$id
region_id
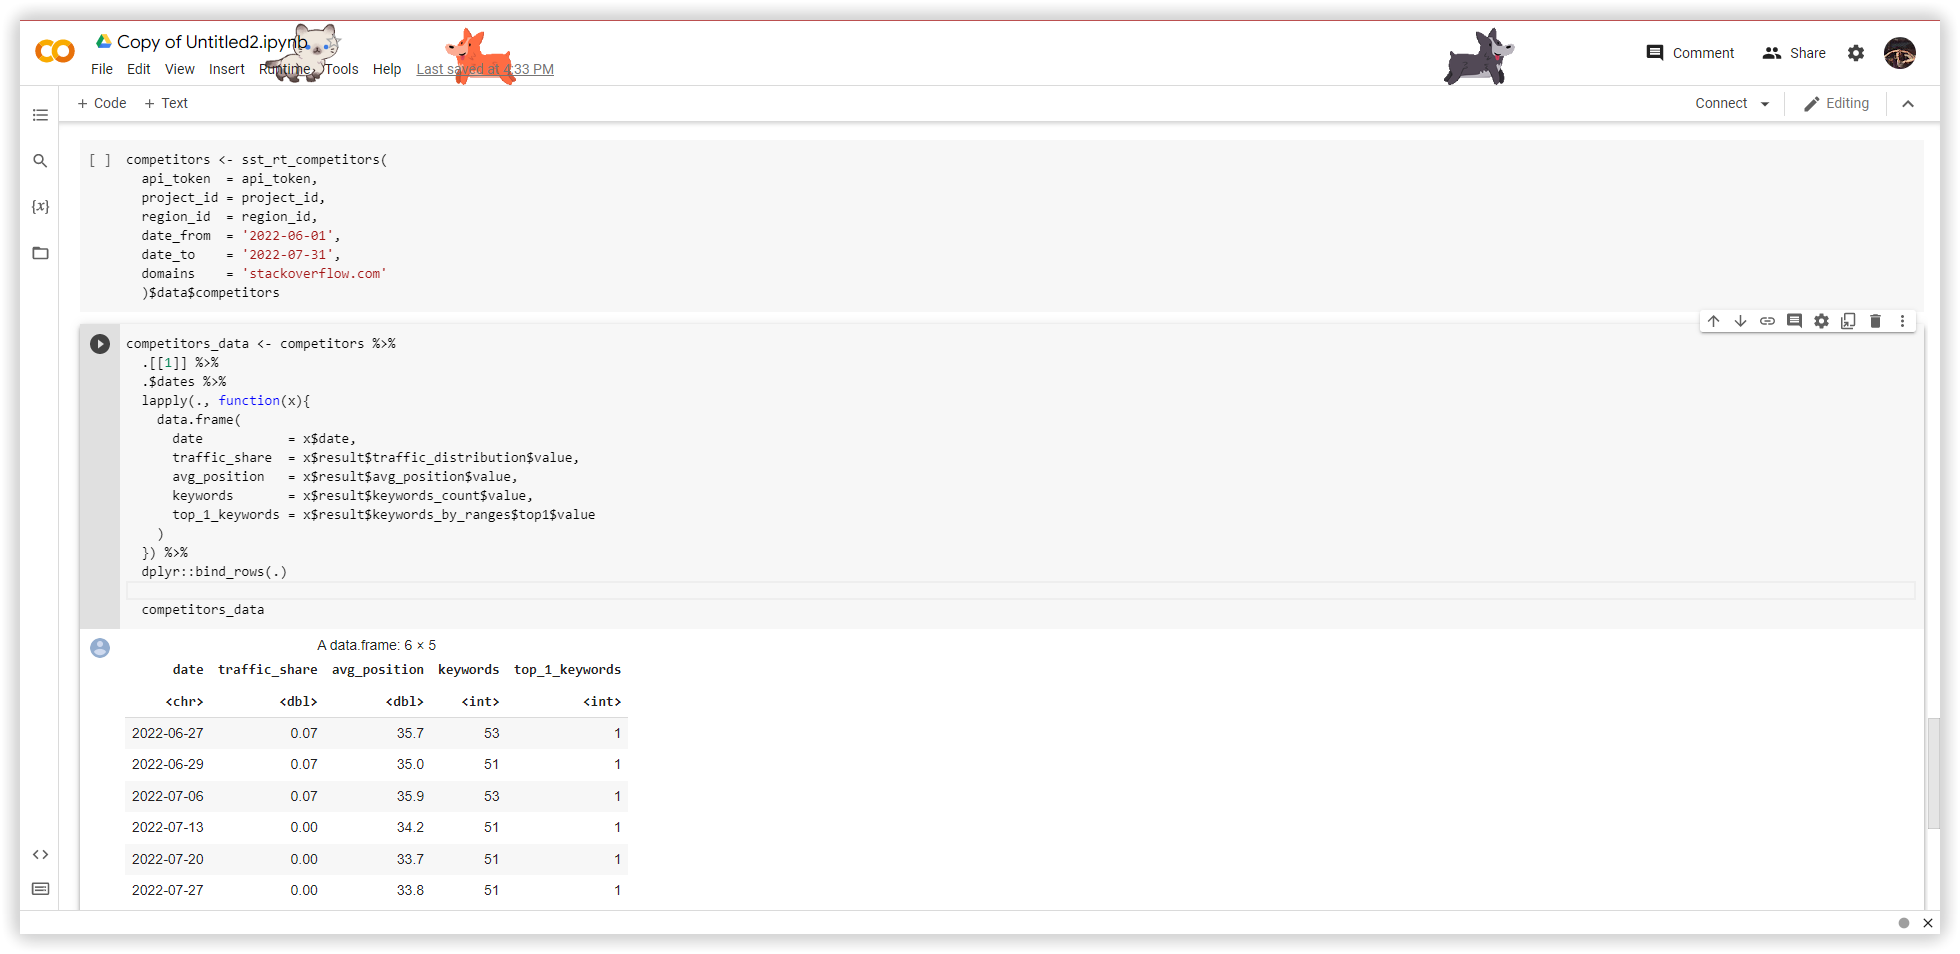
competitors <- sst_rt_competitors(
  api_token  = api_token,
  project_id = project_id,
  region_id  = region_id,
  date_from  = '2022-06-01',
  date_to    = '2022-07-31',
  domains    = 'stackoverflow.com'
  )$data$competitors

Try the platform with free access for 7 days :)
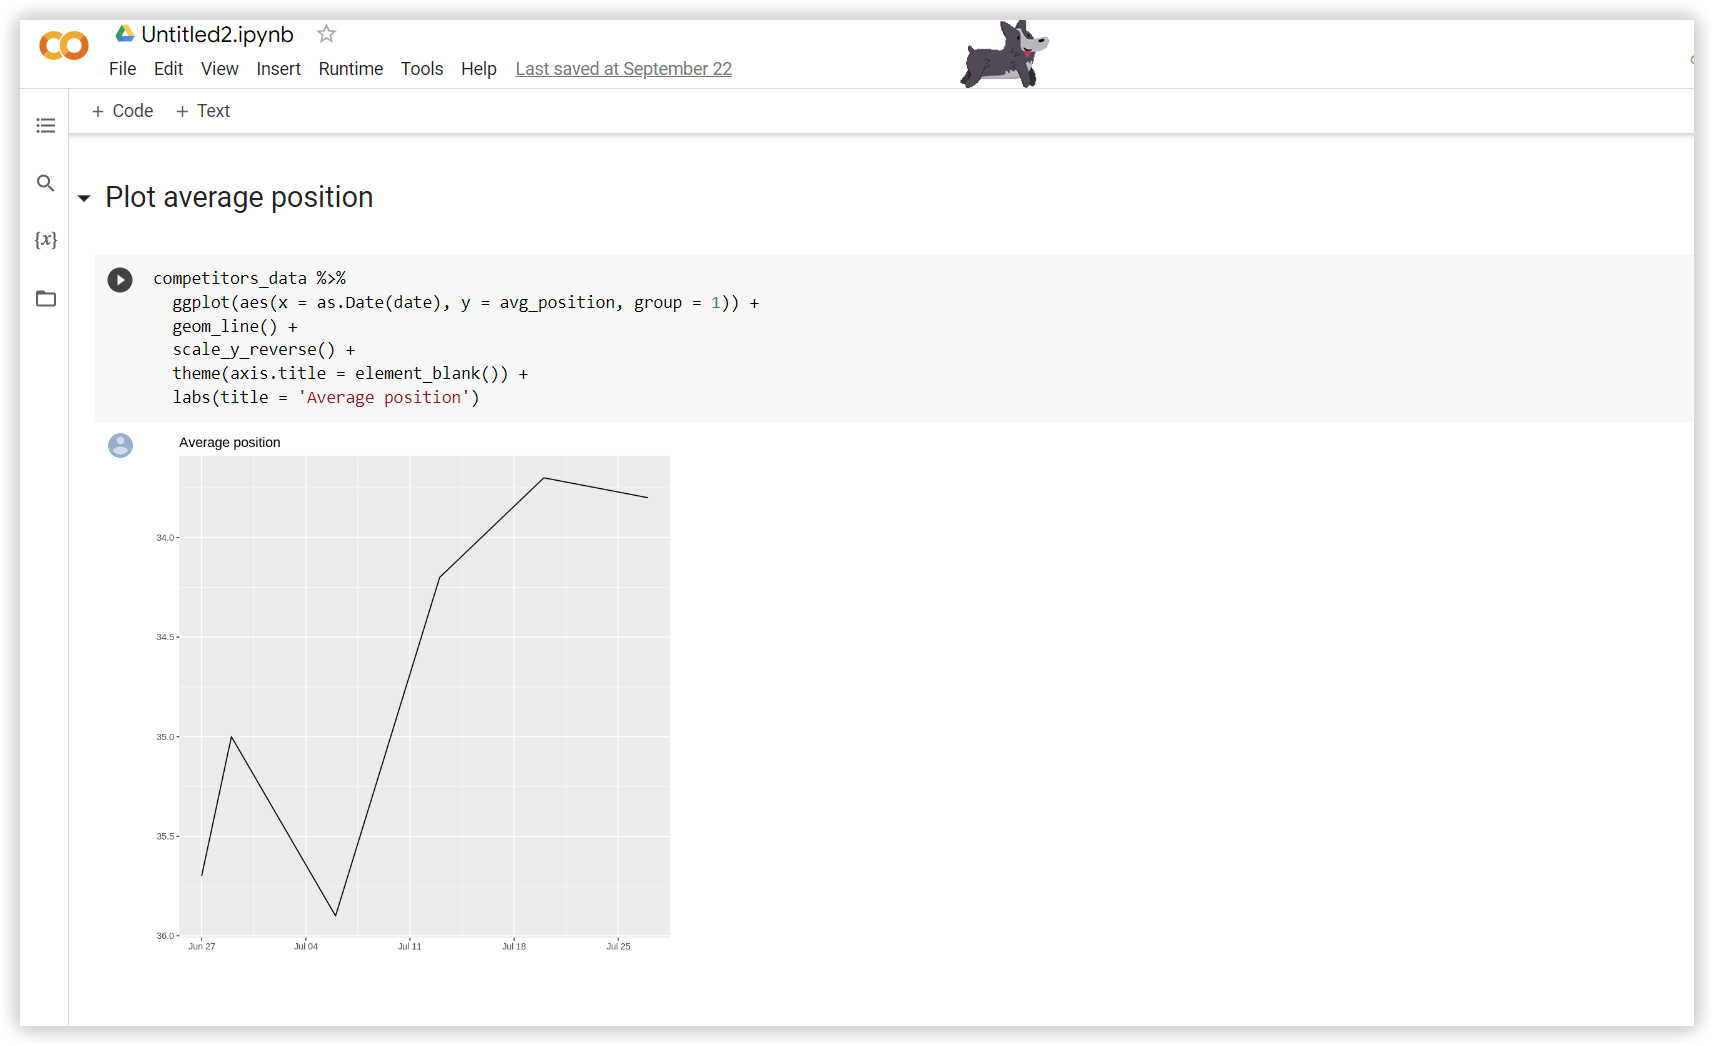
How to work with obtained results? Charts and plots
Thankfully, the elaboration of the programming has made analyzing and utilizing these data much more effortless.
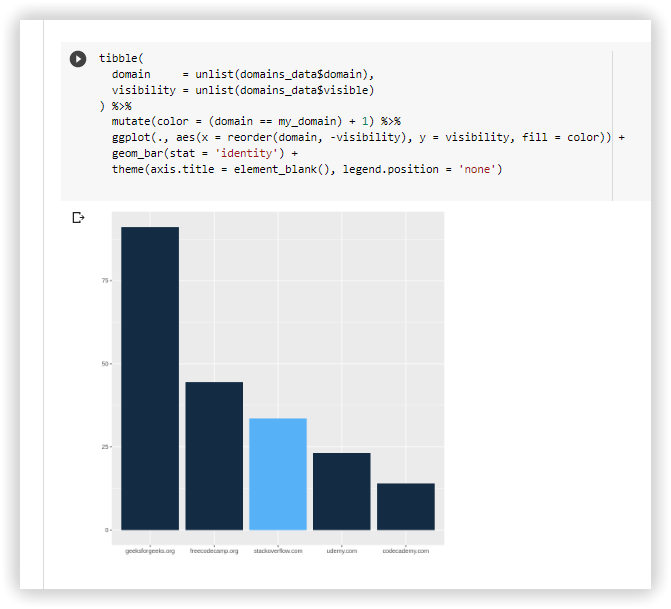
For the dashboard, we will use the dplyr and ggplot2 packages. The first will help us transform the data, and the second will create graphics. We will use them to show the visibility level by domain and the average position of competitors in the Rank Tracker.
Conclusion
All packages in R, including serpstatr, are open source. We would appreciate any suggestions you may have to improve the package or add new features. Reach us at Gitlab.
Speed up your search marketing growth with Serpstat!
Keyword and backlink opportunities, competitors' online strategy, daily rankings and SEO-related issues.
A pack of tools for reducing your time on SEO tasks.
Discover More SEO Tools
Backlink Cheсker
Backlinks checking for any site. Increase the power of your backlink profile
API for SEO
Search big data and get results using SEO API
Competitor Website Analytics
Complete analysis of competitors' websites for SEO and PPC
Keyword Rank Checker
Google Keyword Rankings Checker - gain valuable insights into your website's search engine rankings
Recommended posts
Cases, life hacks, researches, and useful articles
Don’t you have time to follow the news? No worries! Our editor will choose articles that will definitely help you with your work. Join our cozy community :)
By clicking the button, you agree to our privacy policy.